Data Analytics / Business Intelligence • Completed
Real Estate Listings & Customer Review Analytics System
End-to-end real estate analytics platform that processes property listings and customer reviews, performs business intelligence analysis using PostgreSQL and SQL, and delivers actionable insights through interactive Power BI dashboards.
End-to-end real estate analytics platform that processes property listings and customer reviews, performs business intelligence analysis using PostgreSQL and SQL, and delivers actionable insights through interactive Power BI dashboards.
The Problem
Real estate businesses generate massive amounts of listing and customer review data, making it difficult to identify pricing trends, high-performing properties, customer satisfaction patterns, and revenue opportunities. Decision-makers require a centralized analytics solution to transform raw property data into meaningful business insights.
The Solution
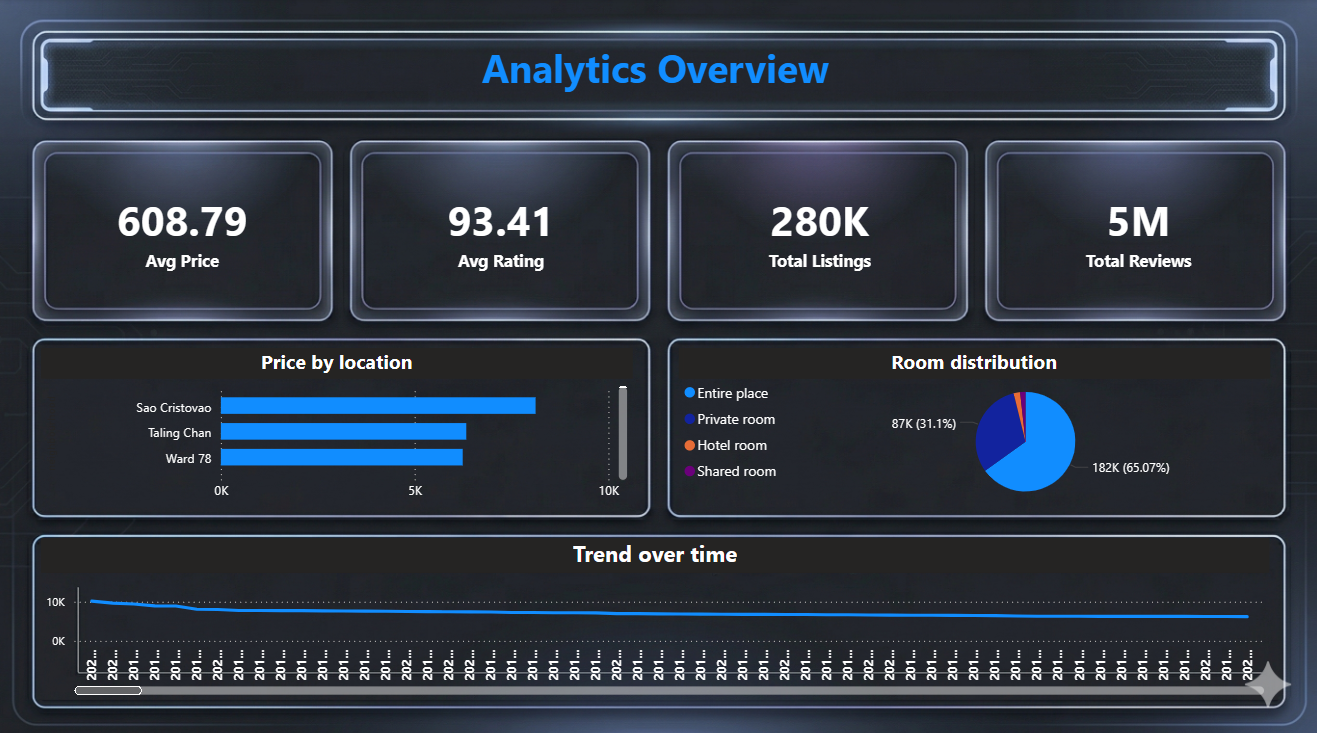
Developed a complete real estate analytics pipeline that cleans and processes property listing and review data, engineers business-focused features, stores structured data in PostgreSQL, performs advanced SQL analysis, and visualizes insights through Power BI dashboards. The system helps stakeholders understand market trends, property performance, customer satisfaction, and pricing optimization opportunities.
Architecture & System Flow
1. Raw listings and review datasets are collected from multiple sources.
2. Python data-cleaning scripts remove duplicates, standardize columns, and handle missing values.
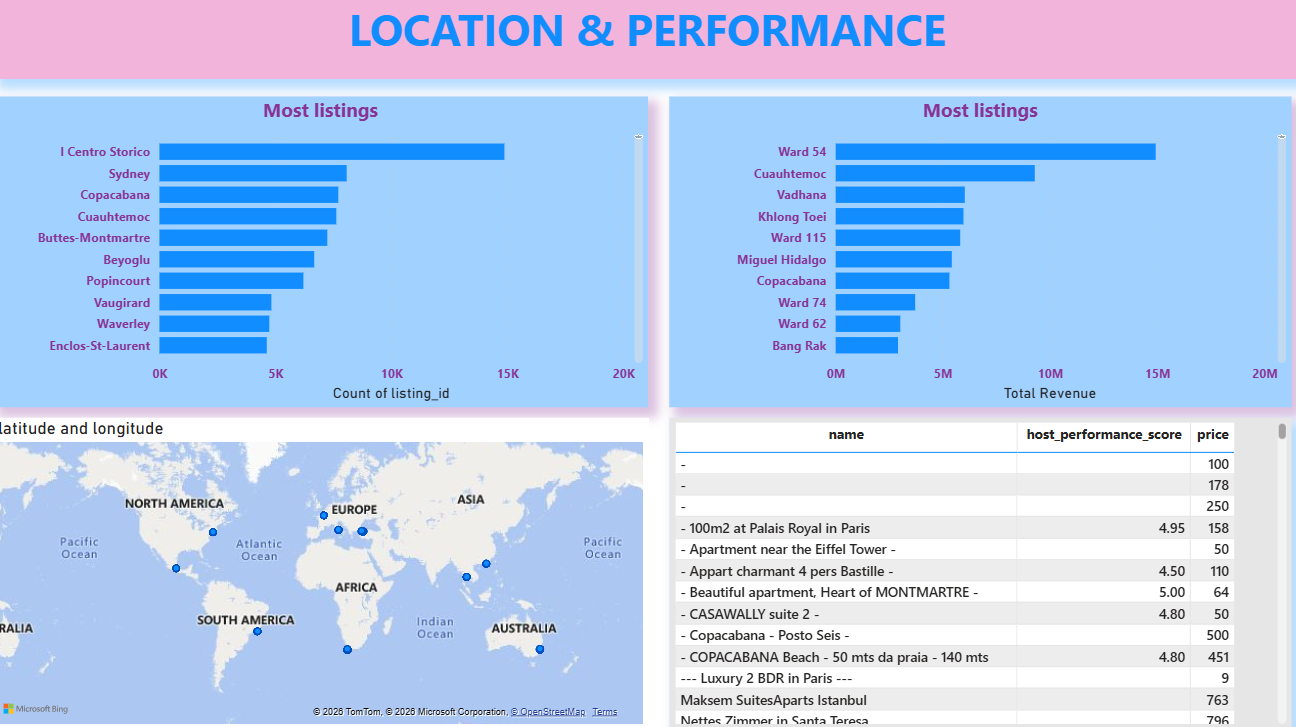
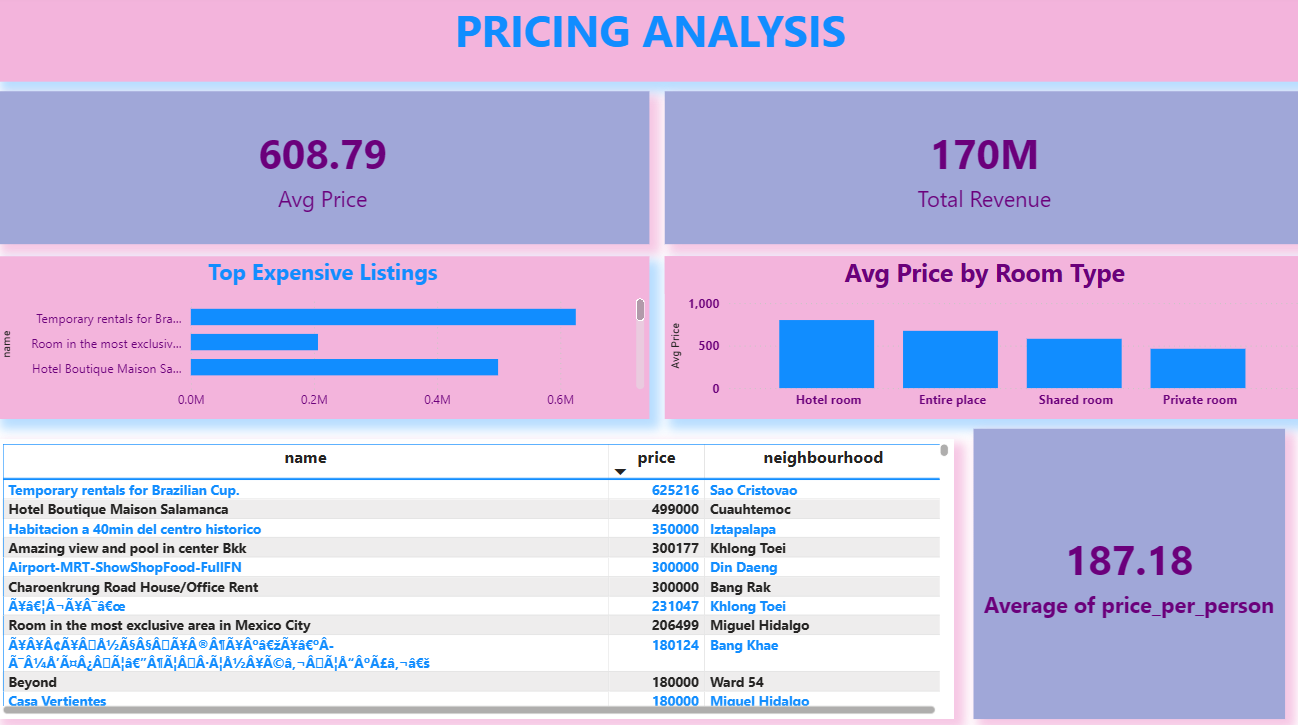
3. Feature engineering generates business metrics such as price_per_person, review_count, and host_performance_score.
4. Processed datasets are stored in PostgreSQL using SQLAlchemy.
5. SQL queries perform pricing analysis, customer satisfaction analysis, listing performance analysis, and location intelligence reporting.
6. Jupyter notebooks support exploratory data analysis and business insight generation.
7. Power BI connects to PostgreSQL and processed datasets.
8. Interactive dashboards provide visual reporting for business stakeholders.
Key Features
✔
Data cleaning and preprocessing pipeline
✔
Property listings analysis
✔
Customer review analytics
✔
PostgreSQL database integration
✔
SQL business intelligence reporting
✔
Feature engineering automation
✔
Pricing trend analysis
✔
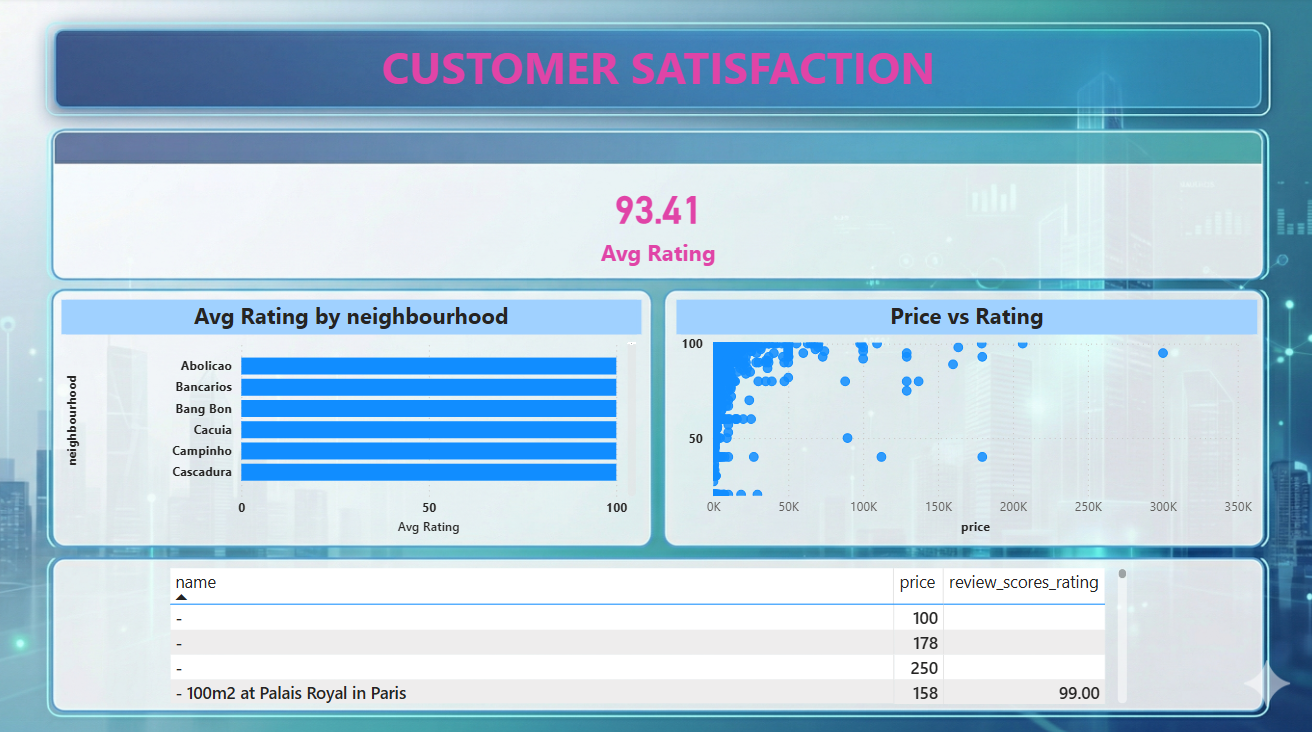
Customer satisfaction analysis
✔
Listing performance evaluation
✔
Neighborhood and location intelligence
✔
Revenue opportunity analysis
✔
Interactive Power BI dashboards
✔
Exploratory Data Analysis (EDA)
✔
Automated reporting workflow
✔
Business insight generation
Challenges Faced
Challenge 1: Managing large-scale property and review datasets.
Solution: Built optimized data-cleaning and preprocessing pipelines using Pandas.
Challenge 2: Extracting meaningful business metrics from raw data.
Solution: Engineered custom features such as price_per_person, review_count, and host_performance_score.
Challenge 3: Performing complex business analysis efficiently.
Solution: Leveraged PostgreSQL and advanced SQL queries for scalable analytics.
Challenge 4: Presenting insights to non-technical stakeholders.
Solution: Created interactive Power BI dashboards with clear visualizations and KPIs.
Challenge 5: Identifying pricing and customer satisfaction opportunities.
Solution: Combined review analysis, location intelligence, and pricing trends to uncover business improvement areas.
Results & Metrics
Developed a complete real estate analytics pipeline that cleans and processes property listing and review data, engineers business-focused features, stores structured data in PostgreSQL, performs advanced SQL analysis, and visualizes insights through Power BI dashboards. The system helps stakeholders understand market trends, property performance, customer satisfaction, and pricing optimization opportunities.